 Alyson Goff
Fill Rate Full Enough? What Fill Rate Reveals About Your Campus Spaces
Higher education is facing a perfect storm: declining enrollment, ballooning deferred maintenance, and increasing pressure to justify every square foot of campus real estate. Yet most institutions are still making high-stakes space decisions without a clear understanding of how their spaces actually perform beyond what is on the schedule.
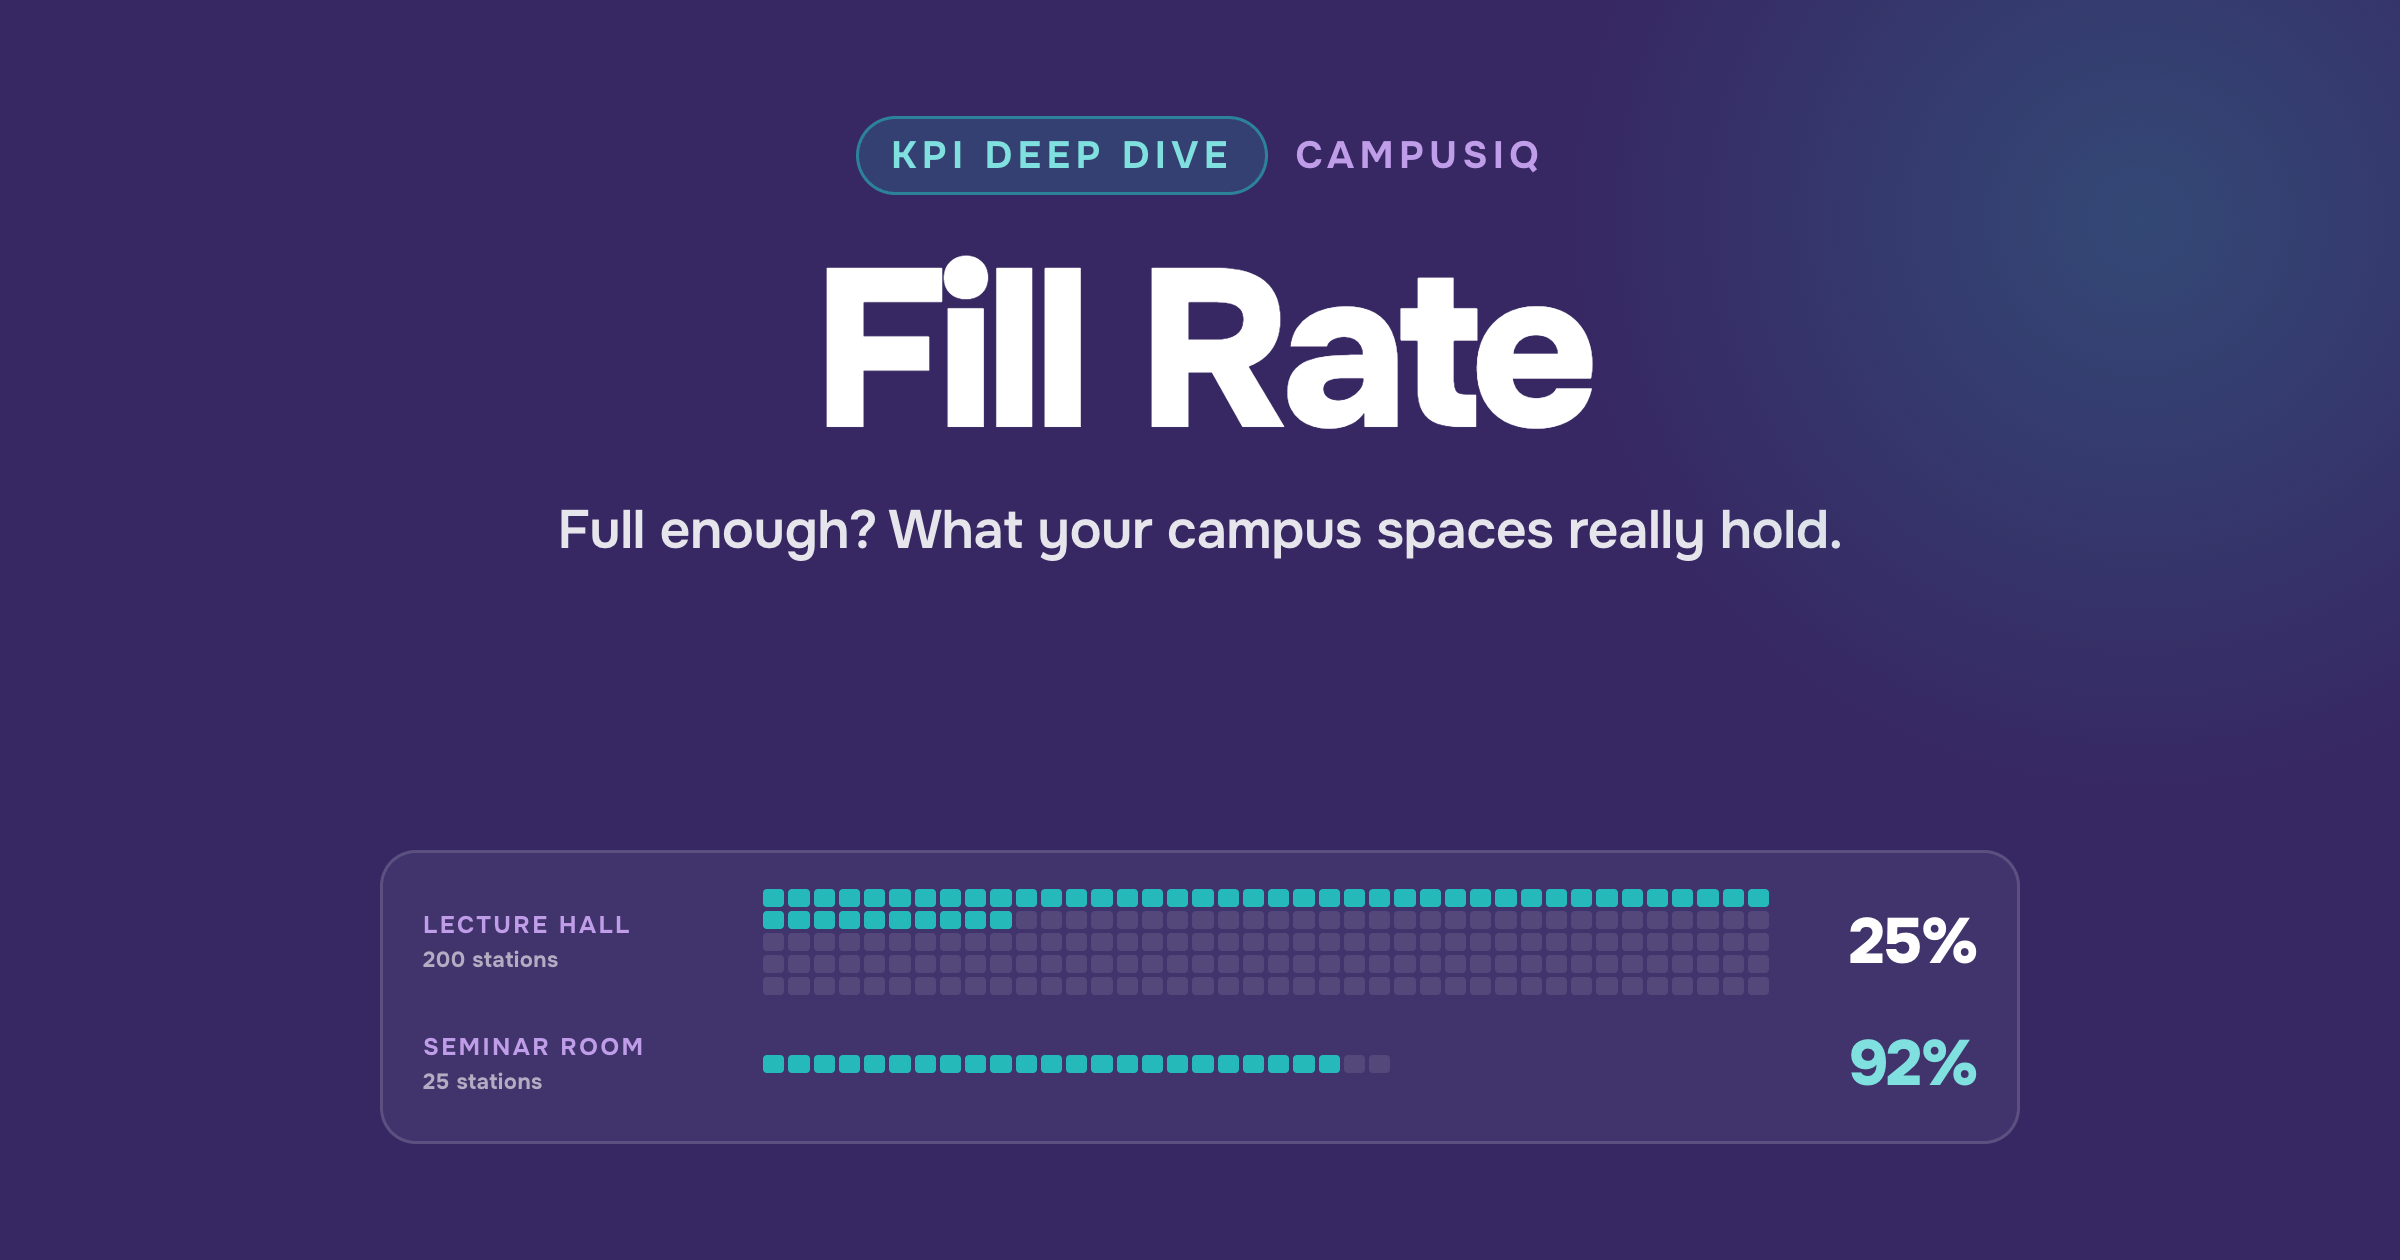
Both zones are “in use.” One cell per station, drawn to the same scale.
Classes may be assigned.
Rooms may appear busy.
But are those spaces truly being used — and used well?
What Fill Rate Really Tells You
That is where fill rate comes in.
Fill rate measures how full a space is when it is actually in use. It captures utilization intensity — not just whether a zone is occupied, but whether its capacity aligns with real demand.
Both zones are technically “in use,” but only one suggests that space is well matched to how it is being used.
This distinction matters more than ever.
In working with a large public research university, CampusIQ encountered a familiar assumption: a newly constructed academic building was believed to be operating near capacity based on schedules alone.
When fill rate was measured during peak demand periods, the data told a different story. Classrooms and labs in the building were consistently running well below institutional utilization targets, while older campus spaces — long viewed as “overdue for replacement” — were experiencing sustained, high demand.
Instead of pursuing additional construction, the institution used objective utilization data to repurpose existing space, avoiding significant capital investment and redirecting resources toward higher-priority academic needs.
For facilities leaders, planners, and academic administrators, fill rate provides a clearer lens for understanding how space actually performs.
Why Traditional Measurement Falls Short
Most campuses still rely on scheduling data, periodic manual counts, or simple presence indicators to understand how space is being used. While these approaches can offer directional insight, they often miss the realities that matter most for planning and investment decisions.
The Attendance Gap
A classroom scheduled for 30 students may routinely host only 18. On paper, it appears fully utilized. In practice, it is operating at 60% of its intended capacity — a meaningful difference when decisions about renovation, consolidation, or expansion are on the line.
The Invisible Usage Problem
Traditional data sources also overlook activity that happens outside formal schedules. Study groups meeting in “empty” classrooms, students working in libraries beyond posted service hours, and research teams using labs during off-peak times rarely show up in zone assignments or headcounts. These patterns shape demand, but they are largely invisible to schedule-based analysis.
The Averaging Trap
Perhaps the most common pitfall is averaging utilization across all operating hours. When high-demand periods are blended with predictably quiet times, spaces that are genuinely constrained at peak can appear underutilized overall.
In a CampusIQ engagement with a large flagship university, early planning assumptions tied to a major campus expansion projected the need for a significant increase in academic space. Scheduling data seemed to confirm the pressure. But when CampusIQ analyzed actual occupancy patterns — hour by hour, across affected buildings — a different story emerged. Demand was highly concentrated in specific peak windows, while substantial capacity existed during much of the day.
By focusing on true peak usage rather than all-hours averages, the institution was able to significantly reduce its planned expansion, avoiding unnecessary construction and the long-term operational costs that would have followed.
Peak windows run near capacity while the all-hours average makes the day look quiet. Illustrative.
Why the 40-Hour Fill Rate Changes the Conversation
Here is where many institutions unintentionally distort their own data.
When fill rate is calculated only during occupied hours, it tells you how full a space was when someone was there — but it says nothing about how much of the week that space was actually earning its keep. A zone that posts strong fill rate numbers during 12 occupied hours and sits empty for the other 68 looks the same as one that performs at that level for 50.
Each block is one operating hour in an 80-hour week.
CampusIQ’s 40-Hour Fill Rate corrects for this by measuring a zone’s total usage across all operating hours against a fixed 40-hour workweek baseline. Every zone is compared on the same scale, regardless of how many hours it is open.
That fixed denominator is what makes the number honest — and what makes it actionable.
A zone that stays open and active for 80 hours a week accumulates far more total station-usage than one open 40 — and because both are measured against the same fixed 40-hour baseline, the busier-for-longer zone posts the higher 40-Hour Fill Rate. That is not a distortion. It surfaces the true cost of keeping a space open: the institution is paying to heat, light, and staff those extra hours, and the metric reflects whether the demand justifies it.
The result is a far more direct view of which spaces are truly constrained, which are carrying more operating cost than their demand supports, and which are well matched to their schedules.
Questions Fill Rate Can Answer
When fill rate is measured correctly, it becomes a decision-making tool — not just a statistic. These are the questions that change how institutions think about their space.
Are your largest zones earning their footprint?
Pull fill rate for your highest-capacity spaces — lecture halls, large labs, auditoriums. These zones carry the biggest cost per hour and the biggest opportunity if mismatched. Consistently low fill rates do not just signal inefficiency; they point to specific right-sizing decisions that free up significant square footage.
Are you building for real demand or scheduled demand?
Compare fill rate against scheduled enrollment for spaces driving capital planning conversations. A persistent gap between how many stations are assigned and how many are actually filled means your planning inputs may be overstating need — and the cost of that overstatement is measured in construction budgets.
Which buildings justify their operating costs?
A low 40-Hour Fill Rate across a building’s zones raises a direct question: do current operating hours, staffing levels, and maintenance schedules match the actual demand this building serves? The answer can reshape how resources are allocated across the portfolio.
Do your “problem” spaces actually have a problem?
Zones flagged for renovation or replacement sometimes tell a surprising story when fill rate enters the conversation. A dated building with strong, sustained fill rates has real demand — and that changes the calculus on whether to renovate in place, expand, or redirect investment entirely. Fill rate separates perception from evidence.
The Bottom Line
In an environment where every dollar is scrutinized, understanding how intensively space is used is no longer optional. It is a core responsibility tied directly to financial stewardship, student experience, and long-term planning.
The real question is not whether institutions can afford sophisticated space analytics.
It is whether they can afford to keep making multimillion-dollar decisions without them.
Fill rate turns space from a fixed cost into a strategic asset — but only if it is measured the right way.
See Fill Rate on your campus →Measurement note
CampusIQ monitors Wi-Fi presence, not exact physical headcount. The algorithm normalizes multiple devices per individual to identify a primary device, so device duplication is not a factor. Individuals not connected to a campus Wi-Fi access point — because of access point placement, network authentication, or device settings — are not detected. A gap between expected occupancy and monitored occupancy may reflect access point placement and connectivity rather than missing people.

Alyson Goff
As CampusIQ’s Senior Director of Insights & Strategy, Alyson helps colleges and universities unlock the full potential of their campuses through data-informed decision making. With 20 years in higher education — including time spent working inside an institution — she bridges analytics and strategy, with expertise spanning space utilization analysis, operational assessments, and frameworks that guide smarter planning. Her mantra: not all solutions are physical.
Connect on LinkedIn →