 Alyson Goff
People Minutes per Sq Ft Not All Square Feet Work Equally Hard
Higher education is facing a perfect storm: declining enrollment, ballooning deferred maintenance, and increasing pressure to justify every square foot of campus real estate. Yet most institutions still evaluate a 12,000 sq ft library floor and a 400 sq ft seminar room with the same percentage on the same dashboard.
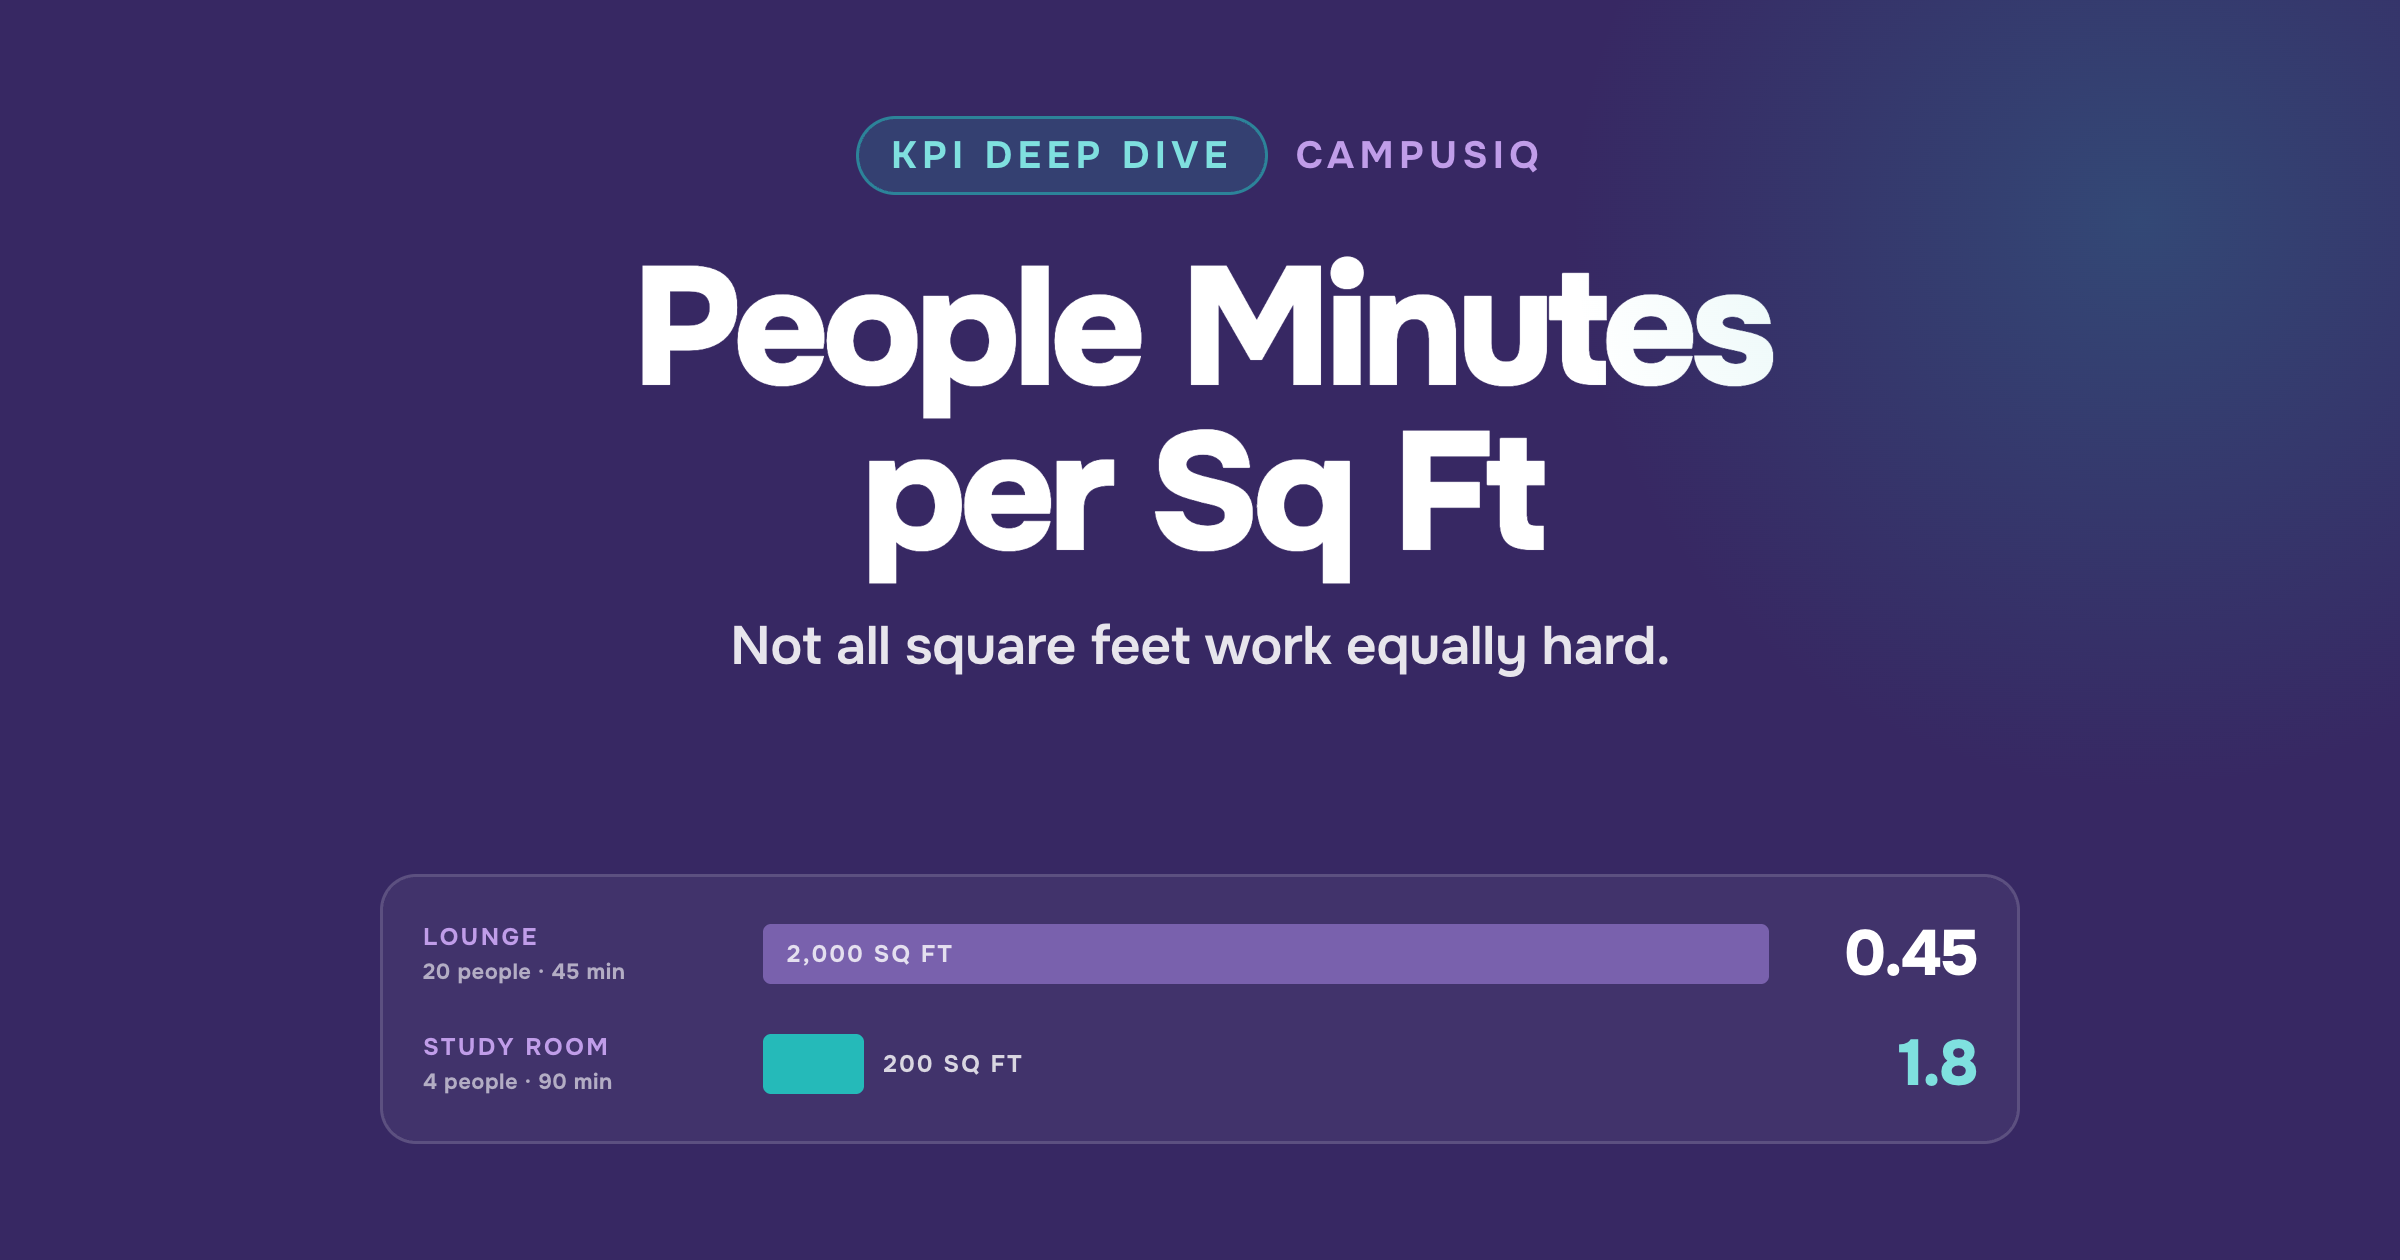
Bar length is footprint, drawn to scale. The number is people minutes per sq ft.
Percentages are useful.
They are also size-blind.
That gap is what People Minutes per Sq Ft closes.
What People Minutes per Sq Ft Really Tells You
A metric that tops out at 100 cannot tell you that one of those rooms is absorbing thirty times the demand per square foot of the other, or that it is the small one.
People Minutes per Sq Ft combines the three things percentage metrics leave out: how many people used a zone, how long they stayed, and how large the zone is.
Two properties make the metric behave differently from anything else on the dashboard.
A two-hour presence contributes far more people-minutes than a fifteen-minute one. Depth of use is visible, not just the fact of it.
A smaller zone with the same people-minutes produces a higher score than a larger one. Footprint is in the denominator, where the cost lives.
The lounge hosted five times the people. The study room is working four times as hard.
This is why People Minutes per Sq Ft is the strongest metric for comparing zones of different sizes on equal footing.
That distinction matters for more than dashboards. Consider a facilities team weighing maintenance priorities for two spaces: the study room absorbs four times the demand per square foot of the lounge — but both appear equally busy on a walkthrough. Only one is working hard enough to justify an accelerated furniture replacement cycle, more frequent custodial service, and a heavier HVAC load. Without a density metric, the team has no way to tell which one.
Why Traditional Measurement Falls Short
Most campuses evaluate space with headcounts, scheduling data, and percentage-based occupancy figures. Each is useful in isolation. Together they still leave the intensity question unanswered.
The Normalization Problem
Percentage metrics deliberately remove scale — that is what makes them comparable, and it is also what makes them incomplete. A 200 sq ft room and a 5,000 sq ft room can both post the same occupancy figure while placing entirely different demands on utilities, custodial staffing, furniture replacement, and network capacity. On the dashboard they are identical. On the Operations and Maintenance budget they are not.
The Snapshot Problem
A manual count captures a moment. It cannot distinguish the person who settles in for two hours from the one who passes through for fifteen minutes, because at the instant of the walk-through they look the same. Those two individuals do not impose the same load on a building, and a metric that treats them identically will misprice the space.
The Size Blind Spot
Comparing raw headcount across zones quietly penalizes small spaces and flatters large ones. A seminar room can never post the numbers an auditorium does, no matter how relentlessly it is used. Institutions that rank spaces by attendance end up defending their largest rooms and consolidating their hardest-working ones.
A campus planning team evaluating two wings of the same building sees identical occupancy percentages on the dashboard. But one wing is 3,000 sq ft serving a rotating cast of short visits; the other is 12,000 sq ft anchoring long research sessions. The percentage says they perform equally. People Minutes per Sq Ft reveals the smaller wing is absorbing sustained, intensive use that will show up in wear, energy consumption, and custodial demand long before it shows up in a headcount.
This is where a space metric becomes a budget metric.
Why Density Changes the Conversation
Operations and Maintenance costs — utilities, custodial services, building repairs, groundskeeping, and the staffing behind them — scale with how hard a space is actually worked, not with how often it appears on a schedule. People Minutes per Sq Ft is the closest single number to that reality, which is why it is the right input for deciding where maintenance effort and resources should concentrate.
The metric is strongest when read comparatively: against peer zones of a similar type, and against itself over time. That is how it surfaces the spaces that quietly carry a campus — and the ones that occupy a footprint without earning it.
How much human use each square foot absorbed.
Questions People Minutes per Sq Ft Can Answer
Which spaces are working hardest per dollar of footprint?
Rank comparable zones by density rather than headcount and the picture usually inverts. The spaces that rise are frequently small, unglamorous, and absent from capital conversations entirely — which makes them the cheapest capacity an institution already owns.
Where should custodial and maintenance effort concentrate?
High-density zones accumulate wear, consume utilities, and require attention on a different cycle than their square footage alone would suggest. Density gives facilities leadership a defensible basis for uneven service levels across a portfolio.
Are your small spaces carrying more than their share?
If a group of small zones consistently posts high density while large adjacent spaces post low density, the institution has a distribution problem rather than a capacity problem. That distinction changes the response from construction to reconfiguration.
Did the renovation change behavior or just appearance?
Because the metric captures people, duration, and footprint together, a before-and-after comparison shows whether an investment produced more sustained use or simply a better-looking room. Few space metrics can answer that question directly.
The Bottom Line
In an environment where every dollar is scrutinized, an institution needs to know not only whether its spaces are used, but how intensively — because intensity is what drives cost, wear, and the case for or against the next building.
Occupied Rate tells you whether anyone was there. Fill Rate tells you how full the space was against its capacity. People Minutes per Sq Ft tells you how much human use each square foot absorbed, and that is the number that connects space performance to the Operations and Maintenance budget.
Square footage is a fixed cost. People Minutes per Sq Ft is what turns it into a measure of return — but only if it is measured the right way.
See People Minutes per Sq Ft on your campus →Measurement note
CampusIQ monitors Wi-Fi presence, not exact physical headcount. The algorithm normalizes multiple devices per individual to identify a primary device, so device duplication is not a factor. Individuals not connected to a campus Wi-Fi access point — because of access point placement, network authentication, or device settings — are not detected. A gap between expected occupancy and monitored occupancy may reflect access point placement and connectivity rather than missing people.

Alyson Goff
As CampusIQ’s Senior Director of Insights & Strategy, Alyson helps colleges and universities unlock the full potential of their campuses through data-informed decision making. With 20 years in higher education — including time spent working inside an institution — she bridges analytics and strategy, with expertise spanning space utilization analysis, operational assessments, and frameworks that guide smarter planning. Her mantra: not all solutions are physical.
Connect on LinkedIn →