
 Veena Vadgama
2 min read
How Augusta University Turned Cultural Change into 97% Research Space Utilization
Every university wants better research space.Few are ready to do what it actually takes to get there. When I sat down with Barbara Manley-Smith,...
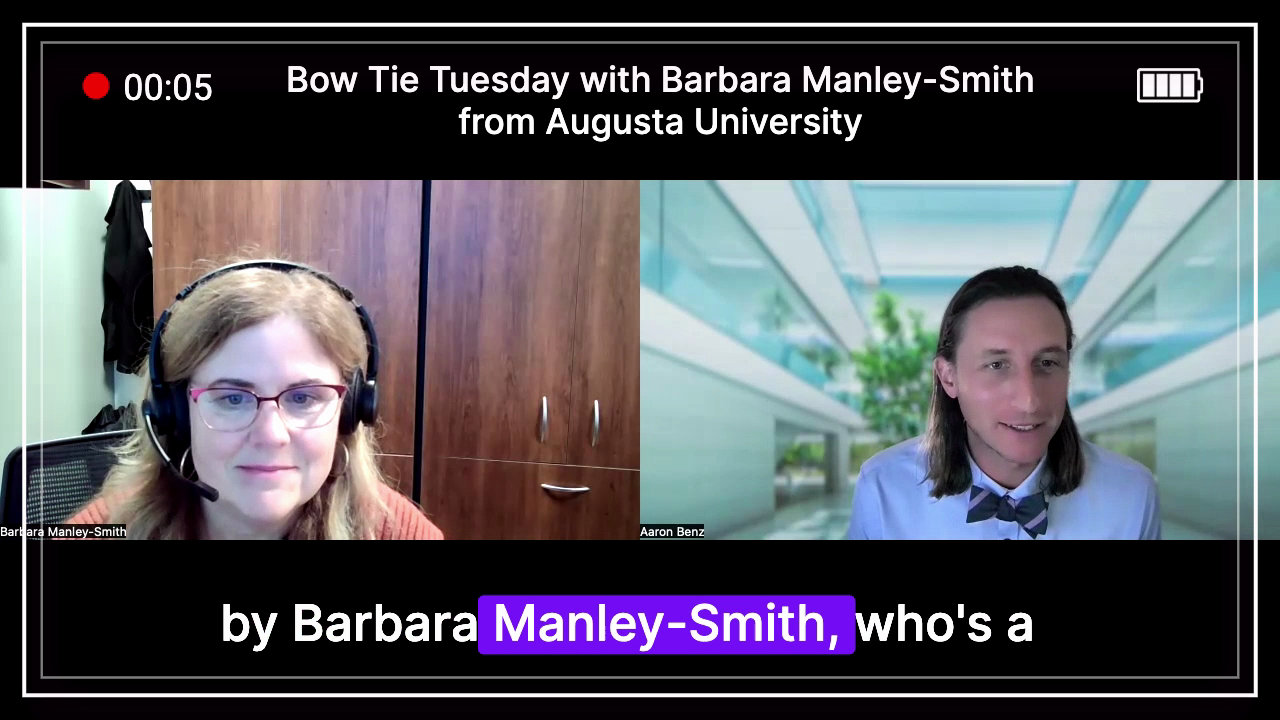
When CampusIQ and Huron surveyed 31 universities across North America for the 2026 State of Space Management in Higher Education report, one finding stood out: the stark divide between how institutions understand their classrooms versus their research facilities. In a recent Bow Tie Tuesday conversation, CampusIQ CEO Aaron Benz and Huron's Andrew Sama explored why this gap exists—and what institutions can do about it.
Research labs are among the most expensive spaces on any campus. They require specialized HVAC, complex safety systems, and significant square footage per occupant. Yet these high-stakes facilities remain surprisingly under-analyzed.
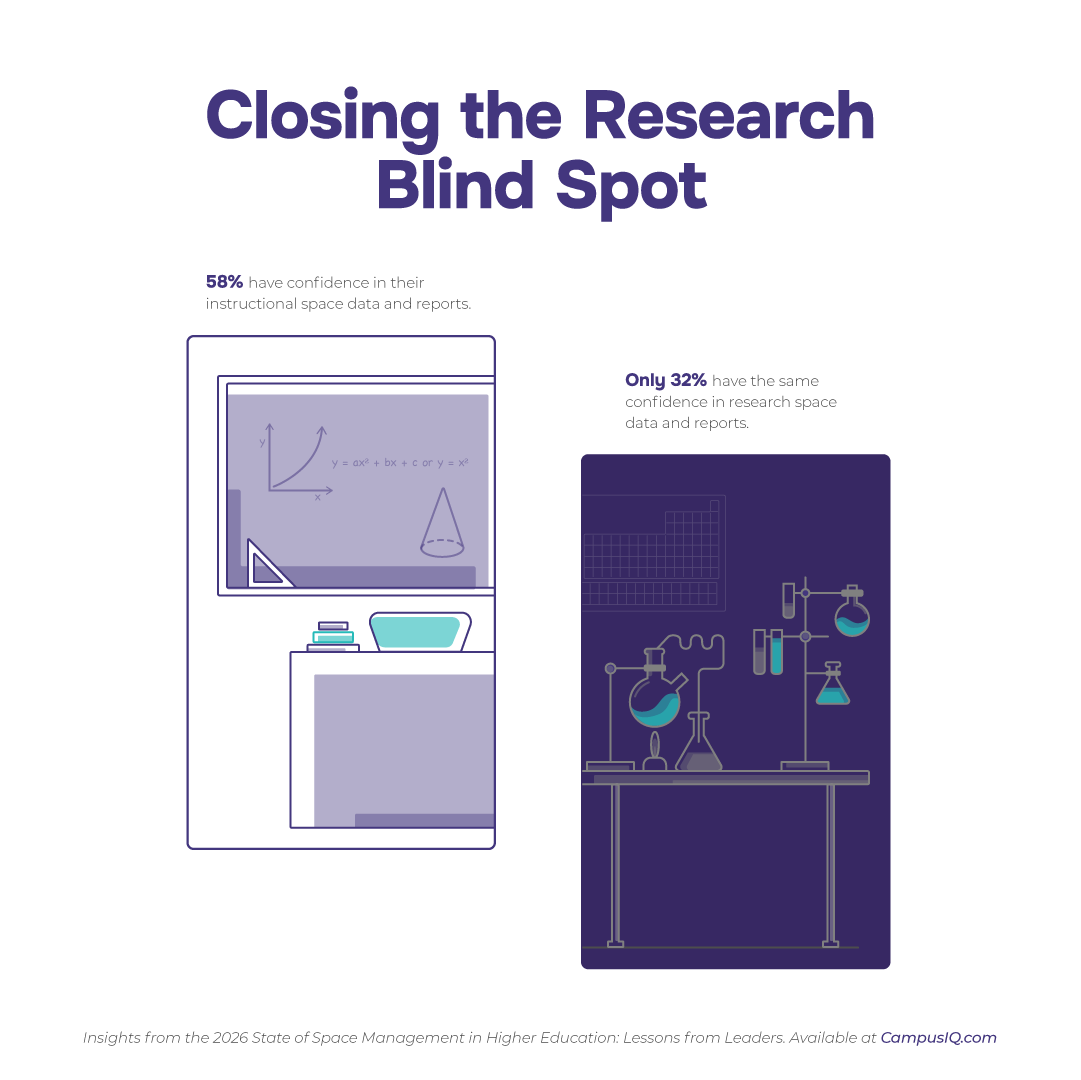
The data tells a striking story: 58% of institutions feel confident in their ability to report on classroom utilization. That confidence drops to just 32% for research facilities.
Why the gap? And what can institutions do about it?

Instructional space benefits from a built-in data source: the registrar. Course schedules, enrollment numbers, and room assignments create a clear picture of how classrooms are being used. It's not perfect, but it's something.
Research facilities don't have that advantage. As one survey respondent put it:
"Instructional space is easiest to measure given registrar data. Research labs and offices are notoriously harder to truly measure."
— Private Research University
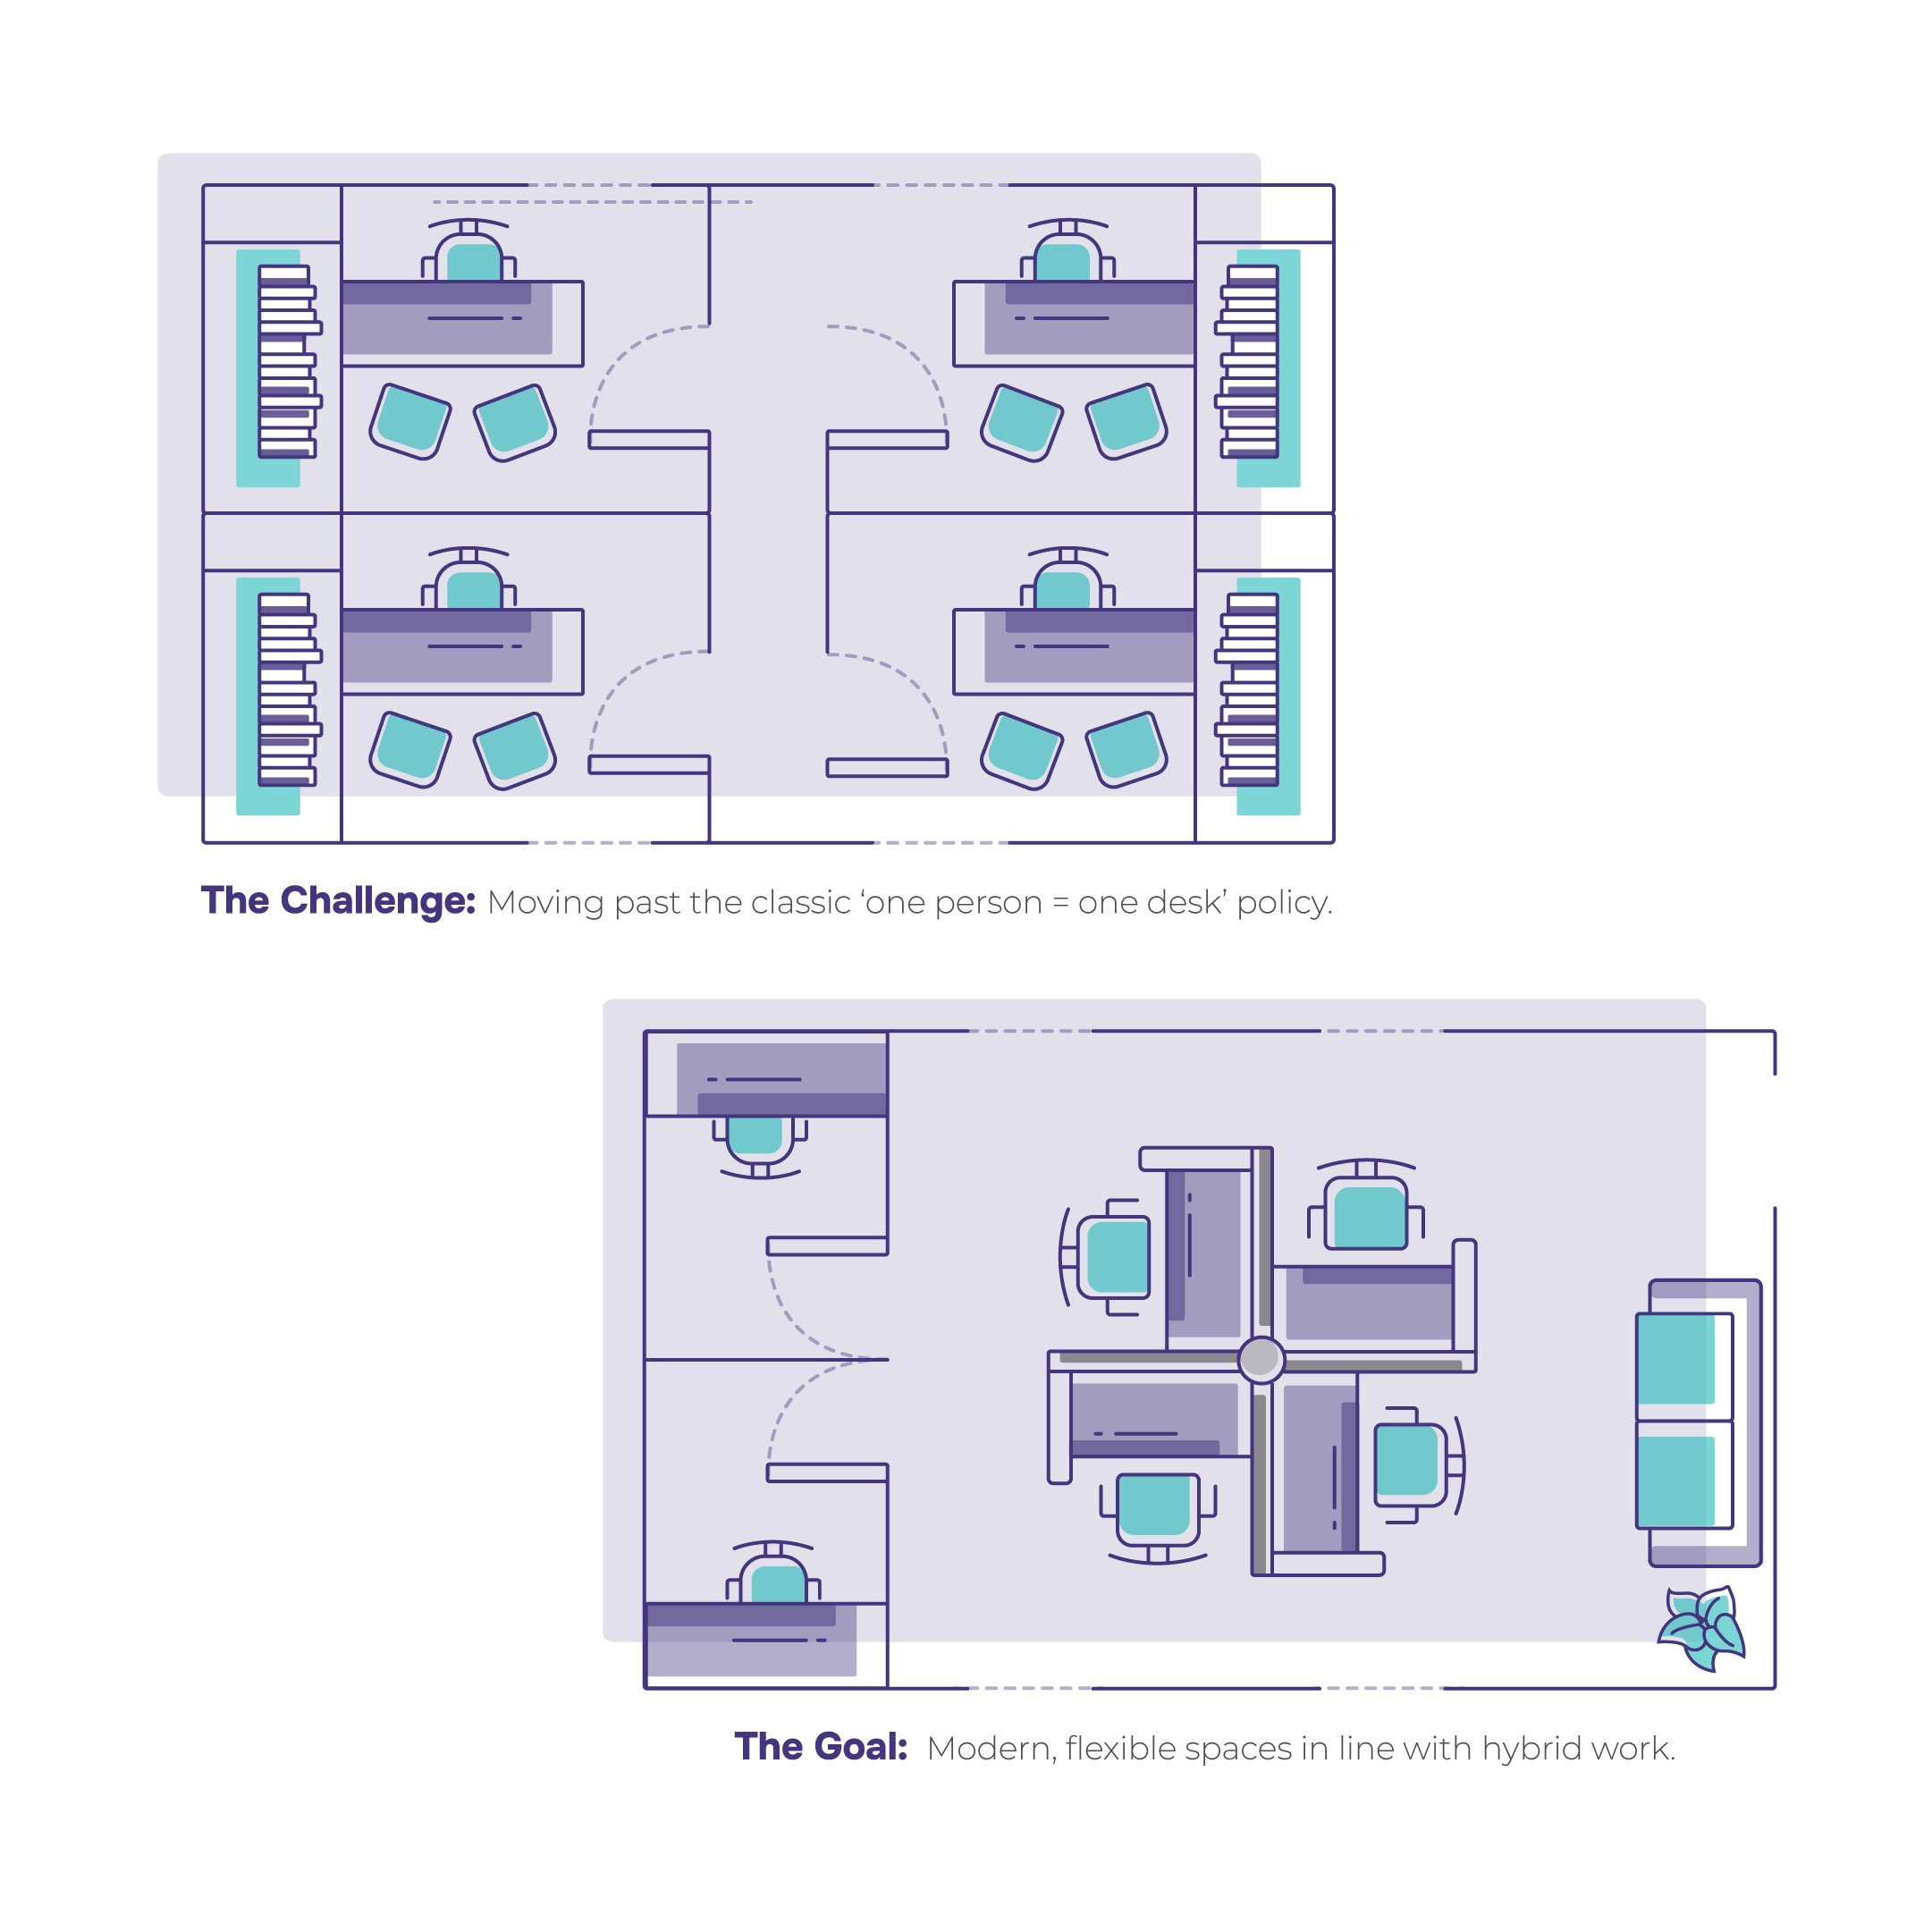
The challenge goes deeper than data availability. Research space is often assigned by grant, by PI, or by department—without a centralized system tracking actual occupancy. Labs may sit half-empty while faculty request more space. Equipment purchased years ago may occupy valuable square footage without ever being used.
The survey uncovered another troubling finding: only 10% of institutions regularly calculate and report on research dollar density—the amount of funding generated per square foot of research space.
This means the majority of institutions have no consistent way to evaluate whether their research space investments are paying off. In an era of constrained budgets and rising stewardship costs, that's a significant blind spot.
Research facilities represent a substantial portion of campus square footage at R1 and R2 institutions—and an even larger share of operating costs. When deferred maintenance backlogs grow and capital budgets tighten, institutions need to make hard decisions about where to invest.
Without reliable data on research space utilization, those decisions are based on assumptions, anecdotes, or the loudest voice in the room.
Meanwhile, institutions have made real progress on classroom analytics. They've moved beyond static schedules to understand actual seat fill rates and room utilization. The opportunity now is to bring that same analytical rigor to research environments.
Institutions that address this gap can unlock meaningful benefits:
The survey found that leading institutions are already starting this work. They're layering occupancy analytics on top of existing inventories—using Wi-Fi data and other non-invasive methods to understand what's actually happening in labs, not just what's scheduled.
Closing the research blind spot doesn't require a massive infrastructure investment. Institutions can begin by:
The institutions that move first will be better positioned to optimize their most expensive assets—and make the case for future investments with data, not guesswork.
The research blind spot is just one of five key insights from the 2026 State of Space Management in Higher Education report. The full report explores how leading institutions are rethinking hybrid work policies, embracing precision over growth, and transforming space governance.
Download the full report to see how your institution compares—and where to focus next.
Want to hear more? Watch the Bow Tie Tuesday discussion between Aaron Benz and Andrew Sama as they unpack the research blind spot and share practical strategies for closing the gap.
2 min read
Every university wants better research space.Few are ready to do what it actually takes to get there. When I sat down with Barbara Manley-Smith,...
by Veena Vadgama, CMO at CampusIQ
by Veena Vadgama, CampusIQ Chief Marketing Officer