
5 min read

Booked, Not Used: What Occupied Rate Reveals About Your Campus Week

Booked, Not Used: What Occupied Rate Reveals About Your Campus Week
KPI Deep DiveCampus Space Metrics

Occupied Rate Booked, Not Used: What Occupied Rate Reveals About Your Campus Week

Higher education is facing a perfect storm: declining enrollment, ballooning deferred maintenance, and increasing pressure to justify every square foot of campus real estate. Yet most institutions are still making high-stakes space decisions from a schedule — a document that records intent, not outcome.

01

A room can be assigned every hour of the week and sit quiet for half of them.

02

A building can look fully programmed and still run cold every Friday afternoon.

03

Before anyone can ask how full a space gets, there is a simpler question to answer: is anyone there at all?

The definition

What Occupied Rate Really Tells You

That is what Occupied Rate measures.

Occupied Rate is the share of a zone’s operating hours that saw real activity.

The formula
Occupied HoursOperating Hours ×100
A conference zone with 40 operating hours per week that is occupied for 30 of them has a 75% Occupied Rate.
30 occupied of 40 operating hours75%

What makes that number trustworthy is what has to happen before an hour counts as occupied. Two thresholds do that work.

Start

Everyone detected

Every individual seen in the zone during the hour — people staying and people passing through.

Filter 1 · Dwell threshold

Users, not passersby

The dwell threshold is the minimum time an individual must be present before they count as a user rather than a passerby. The default is 10 minutes, configurable per institution or per zone.

Filter 2 · Presence threshold

An occupied hour

The presence threshold is the minimum number of users who must be present before the zone counts as occupied at all. The default varies with the reported capacity of the zone — typically 1, 5, 10, or 25 individuals.

151025

A large lecture hall may require 25; a small conference zone may require only 1.

Dwell is applied first. Only individuals who clear it count toward presence. The result measures genuine use rather than movement through a doorway.

In the field · Texas State University · four-building pilotRead the full Texas State story →

In a four-building pilot at Texas State University, every space was occupied through nearly all its operating hours — the buildings were clearly in use. But when the team measured how much of each zone’s capacity was actually filled, the numbers told a different story.

Buildings · share of capacity filled28–57%
Offices · Occupied Rate81%
Offices · capacity used38%
10new doctoral programs

Offices made the point sharpest: occupied 81% of the week, yet only 38% of capacity was used. For an institution absorbing 10 new doctoral programs, that 38% was not a problem — it was headroom.

The question shifted from “do we need more space?” to “are we using what we have?”
The blind spots

Why Traditional Measurement Falls Short

Most campuses still rely on scheduling data, periodic manual counts, or simple presence indicators. These offer directional insight, but they miss the realities that matter most for planning and investment decisions.

The Intent Gap

A schedule records what was assigned, not what happened. A course that meets in a room 12 hours a week tells you the Office of the Registrar allocated 12 hours. It does not tell you whether the section was cancelled, relocated, or shifted to a hybrid format three weeks into the term. Every one of those outcomes leaves the schedule intact and the room empty.

The Passerby Problem

Simple presence sensors count anything that moves. Without a dwell threshold, a custodian walking a corridor, a student cutting through a lobby, and a three-hour study session all register the same way. The metric inflates, and the spaces that look busiest are often just the ones with the most through-traffic.

The Unscheduled Majority

Study groups in “empty” classrooms, research teams working in labs after posted hours, and standing meetings that never entered a room-booking system are invisible to schedule-based analysis. On many campuses this is not a rounding error. It is a meaningful share of real demand, and it tends to concentrate in exactly the spaces an institution is considering repurposing.

The most common misread

A 95% Occupied Rate at the building level does not mean the building is at capacity. It means 95% of that building’s operating hours saw activity in at least some of the end zones beneath it.

Reading the rollup

Why Building-Level Numbers Need a Second Look

Here is where Occupied Rate is most often misread.

That is because Occupied Rate aggregates differently than most people assume. At the end zone, it is the percentage of operating hours that zone was occupied. At the floor and building level, it is the average of the underlying end zones’ individual rates — not a single aggregate time ratio. A building with four end zones at 85%, 60%, 40%, and 15% has a building-level Occupied Rate of 50%.

Read correctly, that 50% is far more useful than it first appears. It does not mean the building is half used. It means that, on average, half the end zones in the building are in use at any given moment — and that one of them is almost always empty.

This is also why Occupied Rate belongs next to the other metrics rather than in front of them. Occupied Rate answers whether. Fill Rate and People Minutes per Sq Ft answer how much. Together they separate a room nobody enters from a room everybody enters and nobody fills.

Whether?
Occupied Rate

Was anyone there at all?

How much?
Fill Rate

How much of the zone’s capacity was used.

How much?
People Minutes per Sq Ft

How much use each square foot carries.

Putting it to work

Questions Occupied Rate Can Answer

When Occupied Rate is measured correctly, it becomes a decision-making tool rather than a statistic. These are the questions that change how institutions think about their space.

01

Which spaces sit dark, and for how long?

Occupied Rate below 50% triggers a Low Usage alert. Sustained low rates across a group of end zones are the clearest candidates for consolidation, repurposing, or release — and the easiest to defend, because the underlying question is binary. Either people were there or they were not.

Zone A
85%
Zone D
15%
| 50% Low Usage alert line
02

Do your operating hours match your operating reality?

If a building’s Occupied Rate is depressed because it is open 80 hours a week and used during 35 of them, the problem may not be the space at all. It may be the hours the institution is paying to heat, light, staff, and clean.

Open
80 h
Used
35 h
03

Where should the next renovation dollar go?

Two buildings flagged for renovation — one at 80% Occupied Rate, one at 20% — are not the same project. The first has demonstrated demand and a strong renovate-in-place case. The second raises a prior question about whether the space is needed in its current form at all.

Building 1
80%
Building 2
20%
04

Is a scheduling change actually working?

Because Occupied Rate is measured continuously against operating hours, it produces a genuine before-and-after on policy changes: a new block schedule, extended library hours, a consolidated department move. No study needs to be commissioned to find out whether the change took.

The bottom line

The Least Glamorous Metric, and Often the Most Decisive

Occupied Rate is the least glamorous metric in campus space analysis and frequently the most decisive. It does not require agreement about capacity, station counts, or the right benchmark. It asks one question every stakeholder already understands:

The one questionWas anyone here?

In an environment where every dollar is scrutinized, that question deserves an evidence-based answer rather than an assumption inherited from a schedule.

Occupied Rate turns the schedule from a plan of record into a claim that can be checked — but only if it is measured the right way.

See Occupied Rate on your campus →

Measurement note

CampusIQ monitors Wi-Fi presence, not exact physical headcount. The algorithm normalizes multiple devices per individual to identify a primary device, so device duplication is not a factor. Individuals not connected to a campus Wi-Fi access point — because of access point placement, network authentication, or device settings — are not detected. A gap between expected occupancy and monitored occupancy may reflect access point placement and connectivity rather than missing people.

About the authors
Alyson Goff

Alyson Goff

Senior Director of Insights & Strategy, CampusIQ

As CampusIQ’s Senior Director of Insights & Strategy, Alyson helps colleges and universities unlock the full potential of their campuses through data-informed decision making. With 20 years in higher education — including time spent working inside an institution — she bridges analytics and strategy, with expertise spanning space utilization analysis, operational assessments, and frameworks that guide smarter planning. Her mantra: not all solutions are physical.

Connect on LinkedIn →
Emma Geltmaker

Emma Geltmaker

Solutions Manager, CampusIQ
Connect on LinkedIn →
Your Space Data Won't Speak for Itself. That's Why We Built This.

Your Space Data Won't Speak for Itself. That's Why We Built This.

Most institutions that invest in space analytics expect the data to do the heavy lifting. Install the platform, turn on the dashboards, and the...

Read More
Research Labs: Higher Ed's Most Expensive Blind Spot

Research Labs: Higher Ed's Most Expensive Blind Spot

When CampusIQ and Huron surveyed 31 universities across North America for the 2026 State of Space Management in Higher Education report, one finding...

Read More
Beyond the Inventory: The Shift to Real-Time Occupancy Analytics

Beyond the Inventory: The Shift to Real-Time Occupancy Analytics

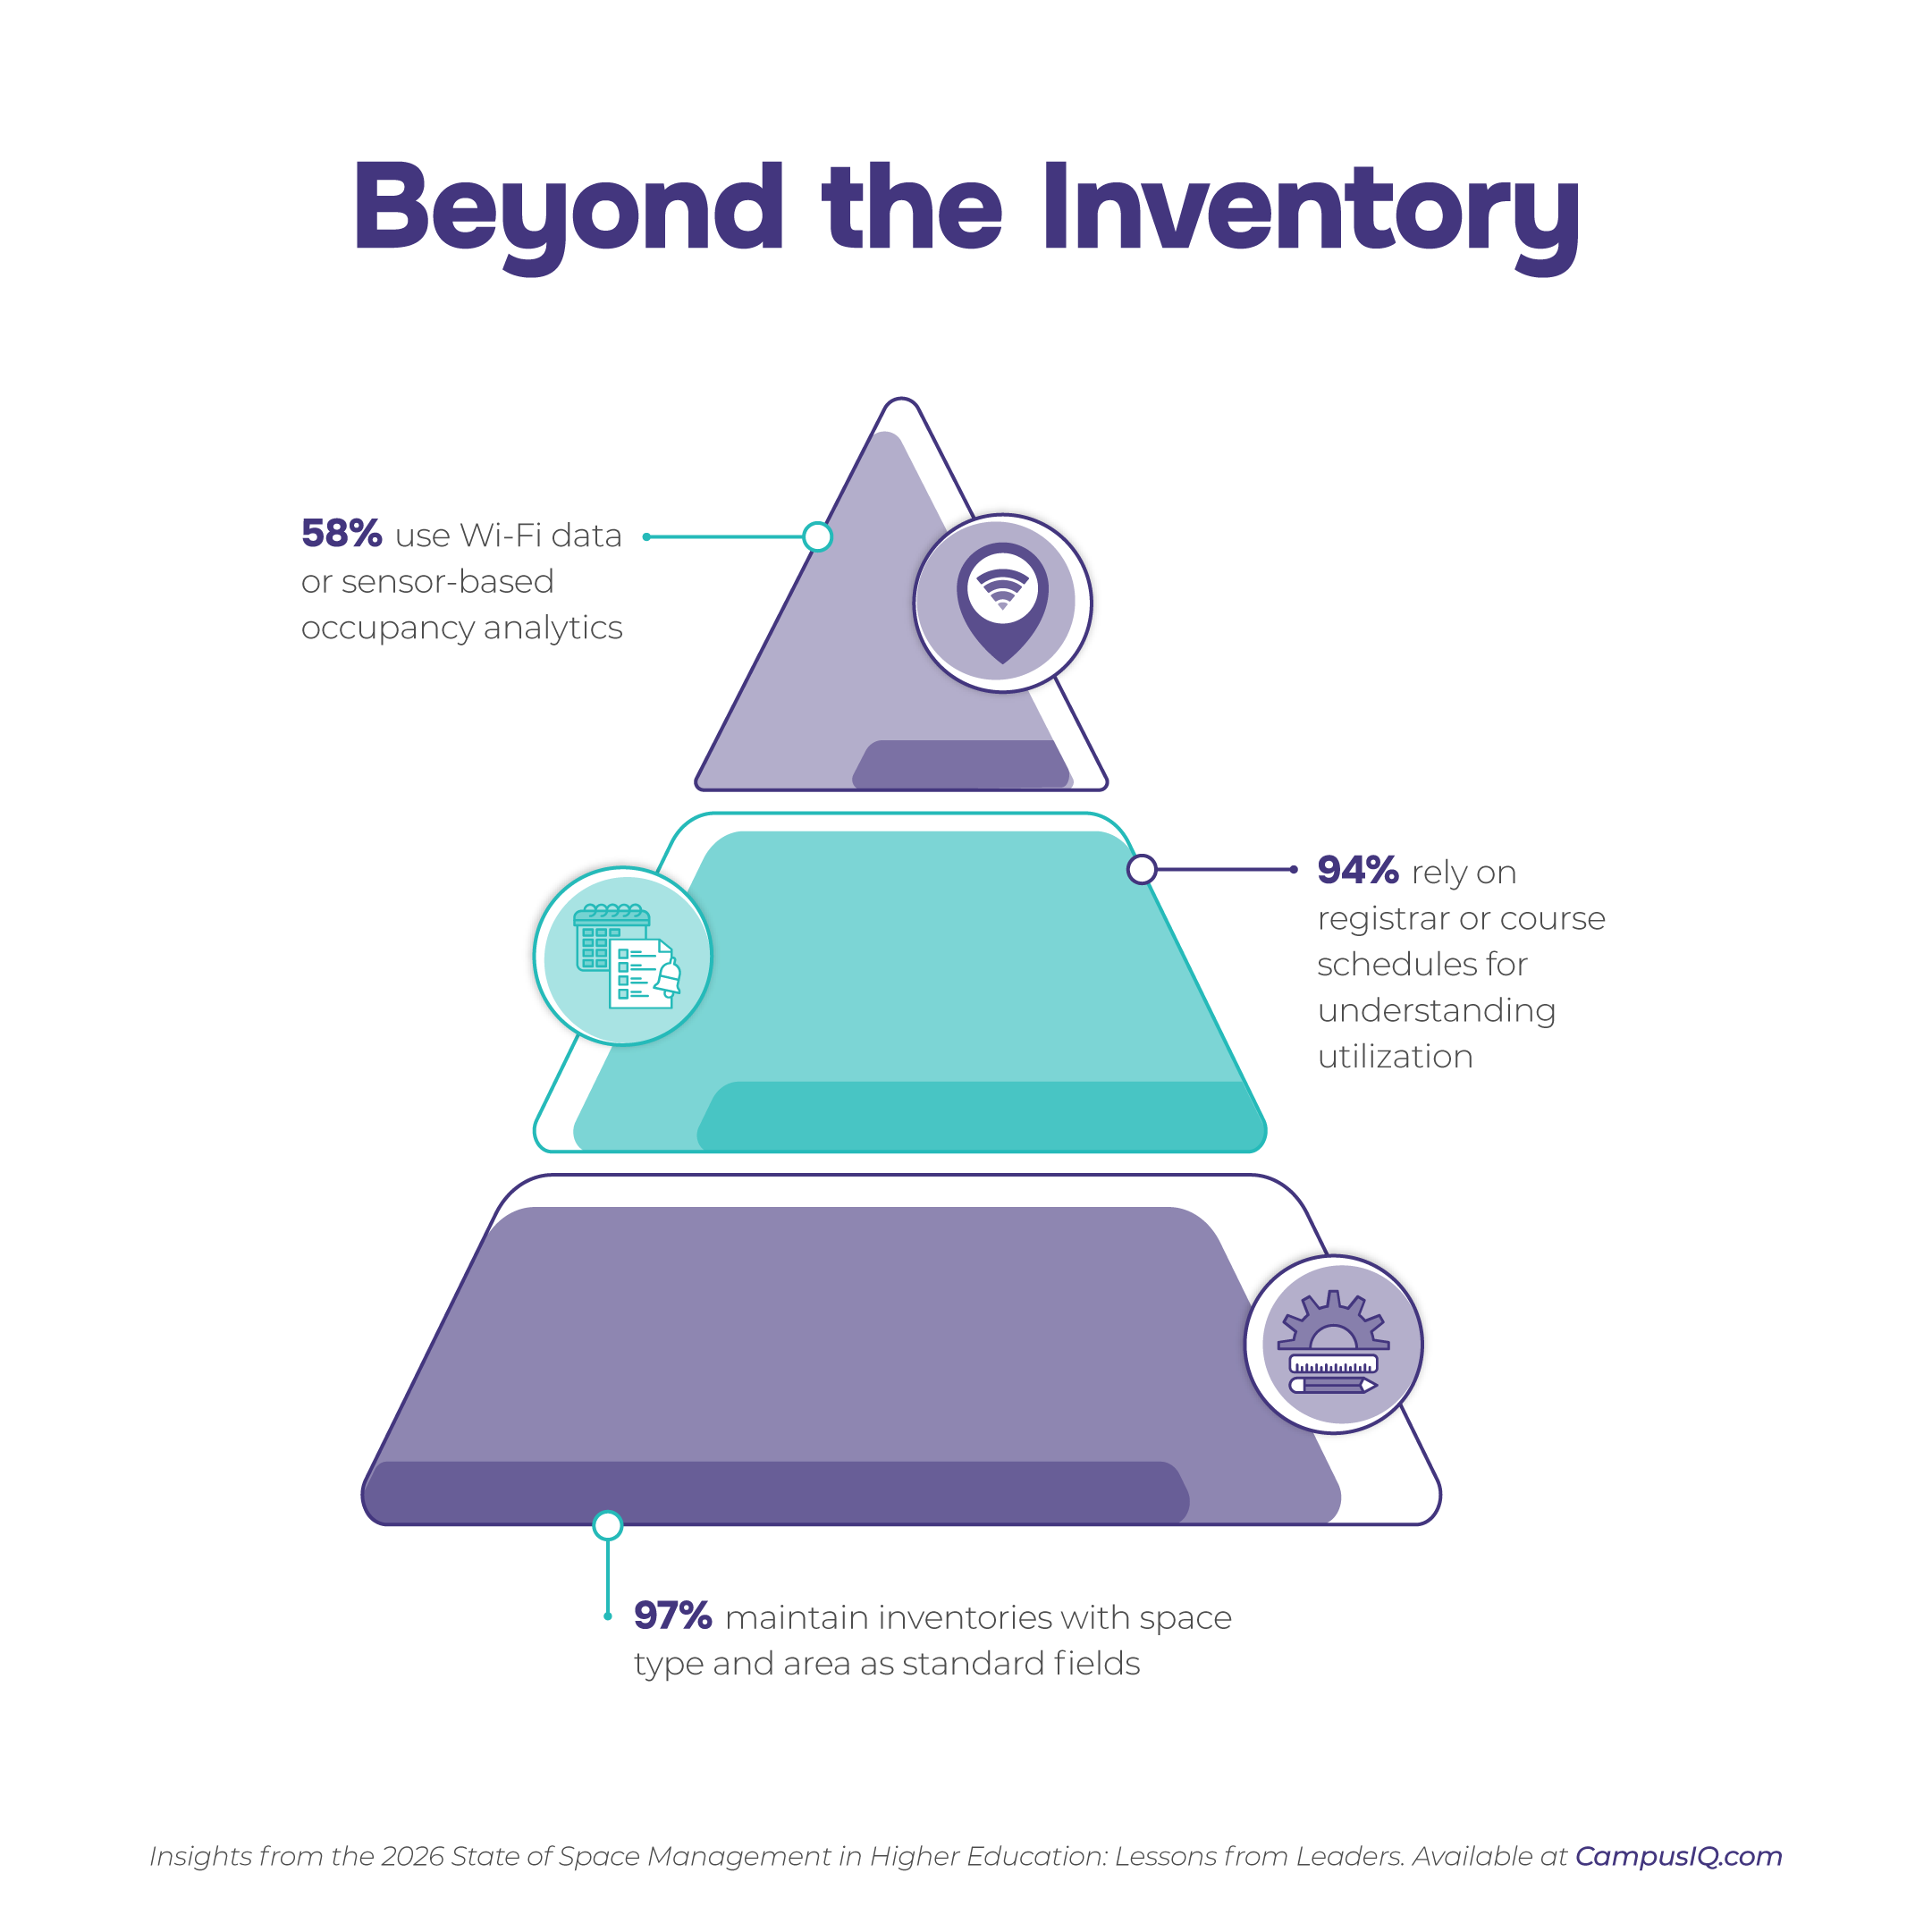
Almost every college and university in North America has a space inventory. According to the 2026 State of Space Management in Higher Education:...

Read More