Space Management is Having Its Heydey: Why Higher Ed Finally Gets It.
I’ve worked in higher education long enough to remember when space management was seen as a back-office task rather than a strategic one. Facilities...
14 min read
Alyson Goff
:
Updated on September 17, 2026
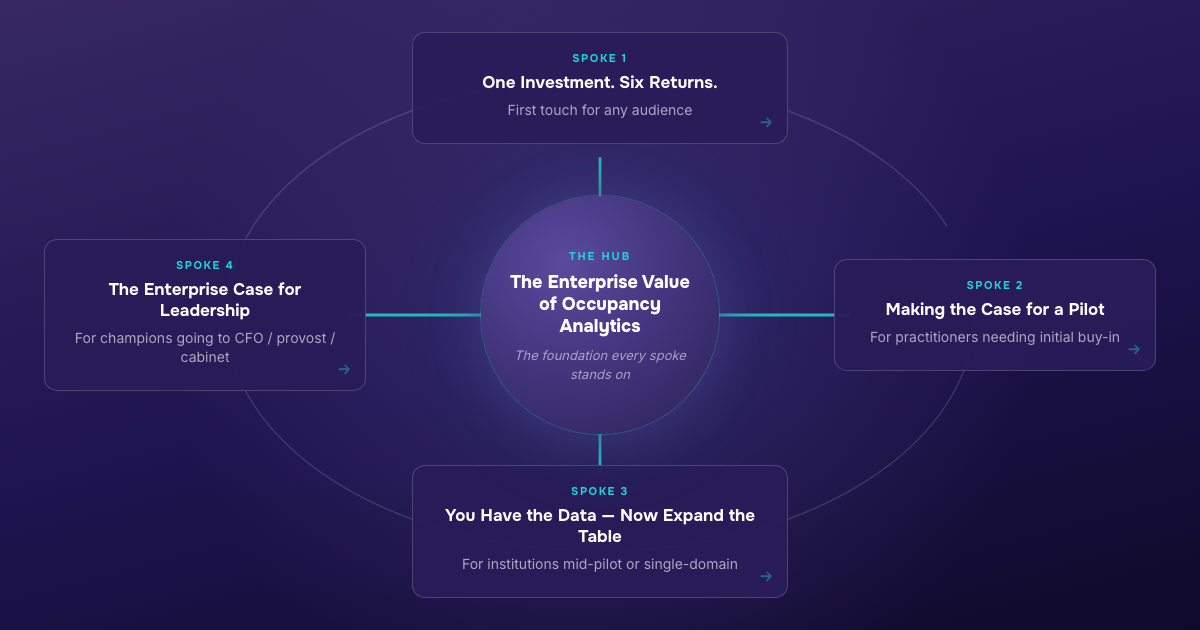
Each spoke is a different way in. All four lead back to the hub.
Alyson GoffSenior Director of Insights & Strategy, CampusIQ
Four guides, four audiences. Each stands alone; all four point back to the hub.
You won’t send all four to the same person. Each spoke was written for someone at a particular point in the conversation — the stranger who’s never heard of any of this, the practitioner who has to ask internally, the institution sitting on pilot data, the champion walking into the cabinet. Pick the one that matches where they are.
The enterprise value case on one page — where occupancy data pays off across six domains. Hand it to anyone, cold.
A practitioner’s guide to getting started — three buildings, one decision, 90 days. For the person who has to ask internally.
How to move from a single-domain pilot to a cross-functional conversation. For the institution already holding data.
How to present occupancy analytics as institutional infrastructure. For the champion walking into the cabinet.
The hub — The Enterprise Value of Occupancy Analytics — is the full framework every spoke stands on. Each spoke can be sent by itself. Together they move an institution from one curious stakeholder to space intelligence as institutional infrastructure.
Send the guide that matches where the reader already is.
See the whole picture — six returns from one investment.
Prove it in three to five buildings with a decision already waiting.
Bring adjacent departments in. Let results create pull.
Fund it as institutional infrastructure, not a departmental tool.
Usually space planning or classroom scheduling. That’s the wrong frame. The same Wi-Fi infrastructure serves six operational domains. One investment. Six returns. The value compounds across all of them.
All four spokes and the hub in one place — where the value lives, the named-institution evidence behind it, and the tools to move from a first pilot to enterprise funding. Read it front to back, or jump to the stage you’re in.
60+ institutions of real peer data. When we say your fill rates are low, we compare against actual peers — not a theoretical model.
Not a dashboard login. A team that builds the methodology, runs the analysis, and presents findings to your stakeholders every week.
The enterprise value of occupancy analytics for higher education.
Most institutions buy occupancy analytics for one reason — usually space planning or classroom scheduling. That’s the wrong frame. The same Wi-Fi infrastructure serves six operational domains. One investment. Six returns. The value compounds across all of them.
Decisions based on actual use — not what’s scheduled, what happened.
AP placement and refresh prioritized by where people actually are, not where coverage maps assumed they’d be.
Staffing and service hours aligned with observed foot traffic, not fixed schedules and meal swipe counts.
HVAC responds to actual building demand instead of conditioning for populations that aren’t there.
Teams routed by yesterday’s traffic, not a fixed cleaning rotation.
Campus engagement measured by observed presence — library visits, student center use, study space traffic — not surveys.
| Domain | What Changes | Proof Point |
|---|---|---|
| Space Planning & Scheduling | Decisions based on actual use — not what’s scheduled, what happened. Fill rates, occupied rates, the gap between booked and real. |
|
| Network & Wireless Infrastructure | AP placement and refresh investments prioritized by where people actually are, not where coverage maps assumed they’d be. | Data-informed wireless redesigns replace blanket one-for-one AP replacements |
| Dining & Food Services | Staffing and service hours aligned with observed foot traffic, not fixed schedules and meal swipe counts. | Northeast R1 University: the #1 lunchtime destination had zero dining (80%+ dwelling); 6 of the top 10 had none — a captive audience transaction data alone couldn’t see |
| Energy & Building Operations | HVAC responds to actual building demand instead of conditioning for populations that aren’t there. | UT San Antonio: Watt Watchers summer pilot (~$100K saved, ~$500K projected annual) |
| Custodial & Facilities Maintenance | Teams routed by yesterday’s traffic, not a fixed cleaning rotation. | University of Kentucky: 30% custodial efficiency gain at Gatton Student Center (97→99% service satisfaction) |
| Student Engagement & Retention | Campus engagement measured by observed presence — library visits, student center use, study space traffic — not surveys. |
|
No single domain justifies the investment alone. All of them together justify it several times over. That’s a coordination problem, not a value problem.
When you know actual building demand, you don’t just save energy. You also route custodial teams more effectively, which reduces labor costs, which frees budget for the AP upgrades that improve data accuracy, which sharpens space planning, which informs the student engagement analysis retention teams need. The flywheel only turns if someone sees the whole picture.
Existing Wi-Fi infrastructure. No new hardware in most cases. The access points already deployed across campus generate the data — occupancy analytics turns it into operational intelligence.
→ Where to start: you don’t need the enterprise story on day one. You need three buildings and one stakeholder with a decision waiting. Making the Case for a Pilot
A practitioner’s guide to getting started with occupancy analytics.
You don’t need the enterprise story to get started. You need three buildings, one stakeholder with a decision waiting, and a pilot that produces results worth talking about. This section helps you frame the ask, pick the right buildings, and set up a pilot that creates demand for the enterprise conversation — without requiring it upfront.
A pilot building checklist, three framing scripts (facilities / CIO / CFO), and the two metrics that answer questions across multiple domains immediately.
The most common mistake is pitching occupancy analytics as an enterprise platform before anyone’s seen the data. That’s a hard sell. Better path: start with the domain where someone already has an unanswered question.
If facilities or the provost’s office is debating whether to build, renovate, or reallocate — and the conversation’s running on scheduled use data and anecdotal complaints — occupancy data changes the terms immediately.
If your institution spends $3–5M+ annually on building energy and facilities suspects you’re conditioning buildings for populations that aren’t there, even a modest pilot shows the gap. UT San Antonio’s summer Watt Watchers pilot saved ~$100K, with ~$500K projected annually.
If custodial or dining leadership is open to demand-based routing, the feedback loop is weeks, not semesters. University of Kentucky boosted custodial efficiency 30% at the Gatton Student Center while improving service satisfaction from 97% to 99%.
Pick the domain with a champion who needs the data now. The entry point matters less than the urgency.
Three to five buildings. Enough to show patterns without requiring campus-wide deployment.
| Building Type | Why Include It | What You’ll Learn |
|---|---|---|
| High-traffic instructional building | This is where the scheduled vs. actual gap is most visible. Large lecture halls and classrooms with known scheduling pressure. | Fill rates vs. capacity, peak demand windows, whether “fully scheduled” means “fully used” |
| Student-facing space (library, student center) | Non-instructional use is the hardest to measure today. Student affairs and enrollment teams have no visibility here. | How students use campus beyond the classroom — when, where, in what numbers |
| Building leadership has questions about | The one someone wants to renovate, expand, or repurpose. The building where the capital request is pending. | Data to inform or defer a capital decision — often the highest-value insight from a pilot |
Avoid residence halls. The use case is different — 24/7 occupancy, privacy concerns, different stakeholder dynamics — and it complicates the pilot story.
Texas State University started with exactly this shape: four buildings — a high-traffic library, a classroom-dense hall, a business college, and an admin building — roughly 740,000 sq ft, all on existing Wi-Fi. Within about 30 days a floor-level dashboard was live.
The finding that changed the conversation: across the four buildings, spaces were occupied 97% of the time but filled to only 38% of capacity. Course schedules said the buildings were full; the Wi-Fi data said they weren’t. That four-building pilot became a conversation with leadership about scaling across the entire campus.
The pilot ask isn’t “buy an enterprise analytics platform.” It’s smaller, more specific, tied to a decision already on someone’s desk.
“We’re making a $[X]M decision about [building] based on scheduling data. Before we commit, can we spend 90 days understanding what’s actually happening in that building and two others? The data comes from our existing Wi-Fi — no new hardware.”
“We’re replacing APs across [X] buildings this cycle. Before we finalize the design, can we use occupancy data from three pilot buildings to prioritize which spaces need dense coverage vs. broad coverage? It’ll make the refresh more targeted.”
“We spend $[X]M annually on energy across [X] buildings. Facilities believes we’re overcooking buildings running at a fraction of their scheduled capacity. A 90-day pilot in three buildings would show us the gap between what we’re spending and what we need to spend.”
In every case, the ask is scoped (three to five buildings, 90 days), tied to a decision already in motion, low-risk (it runs on infrastructure you already own), and measurable — you’ll know whether it worked.
Don’t try to measure everything. Two metrics answer questions across multiple domains immediately: (1) building-level demand — people per building per hour, the foundation; and (2) scheduled vs. actual occupancy in instructional spaces — the gap that changes capital planning conversations. A building scheduled at 85% that runs at 40% actual is a different story than anyone assumed.
Everything else — zone-level detail, student engagement patterns, dining traffic — comes after the pilot proves baseline value.
If the pilot works — and at institutions with real scheduling pressure or energy spend, it typically does — you won’t need to sell the next phase. The energy team will want building demand data for HVAC scheduling. Custodial will want routing recommendations. Student affairs will want to see the library and student center numbers.
The pilot creates pull, not push. That’s the point. Start with one domain, let results create demand, let the enterprise story build itself from the evidence.
→ When you’re ready to bring other stakeholders to the table: You Have the Data — Now Expand the Table
How to move from a single-domain pilot to a cross-functional conversation.
Your pilot worked. You have occupancy data from a handful of buildings, and the stakeholder who championed it sees the value. Now the question is: who else should be looking at this?
The answer is almost everyone who allocates resources based on how people use campus spaces — and none of them know this data exists yet. Your job right now: get two or three more people to see it.
A “who to invite next” matrix, a champion-mapping approach, and the one question that surfaces every stakeholder’s business case.
Start with the domain closest to your entry point. Shared data, shared infrastructure, or shared budget conversations create the natural bridge.
| If You Led With | Invite Next | Why |
|---|---|---|
| Space Planning | Energy / Facilities Ops | They share building-level data. The “are we overcooking this building?” question is one data pull away from what you have. |
| Energy | Custodial | Same facilities leadership, same building-level demand signal. If energy is seeing underoccupied buildings, custodial is cleaning them on a fixed rotation. |
| Network / IT | Facilities / Space Planning | They share infrastructure decisions — AP placement, cabling, building coverage. Network data already implies occupancy; making it explicit unlocks facilities conversations. |
| Custodial | Energy | Same demand signal in reverse. If custodial is routing based on building traffic, energy should be conditioning based on it too. |
| Dining | Student Affairs | Dining foot traffic patterns overlap with student engagement patterns — where students are, when they’re on campus, which locations draw them. |
Don’t invite everyone at once. Two adjacent domains in the first round is plenty.
A 30-minute walkthrough of one building’s data. That’s it. Not a deck. Not a platform demo. One building, three things:
“If you had this data for your buildings, what decision would you make differently this semester?”
Write down the answer. That’s their business case.
Don’t pitch. Don’t explain the enterprise platform vision. Don’t talk about ROI multiples. Let them connect their own operational question to the data they just saw. The best advocates for expanding occupancy analytics aren’t the people who got sold on it — they’re the ones who saw the data and realized what they’d been missing.
Once two or three domains are engaged, other applications surface organically. Don’t pitch them — be ready when someone asks.
“Can you tell us how many people are in each building right now?” Yes. Floor-level in some cases.
“Does building demand correlate with lot use?” Usually, yes.
“Can we validate attendance estimates after large events?” Yes, with building-level demand.
“Can we see actual lab use vs. allocated hours?” If the building has APs, yes.
Each new use case adds to the enterprise return without requiring new capital investment. The infrastructure is already there.
→ Ready to make the enterprise case? The Enterprise Case for Leadership gives you the narrative structure and the framing to present occupancy analytics as a single investment with compound returns.
How to present occupancy analytics as institutional infrastructure.
You’ve seen what occupancy data does in one or two domains. Now you need to convince leadership — CFO, provost, cabinet — to fund it as an enterprise investment instead of a departmental tool.
The challenge isn’t value. It’s visibility. Each department can only justify its own slice of the return, even though the same data serves all of them. The result: competing budget requests for what’s fundamentally the same capability, and nobody showing the full picture.
Here’s what leadership is seeing today. Facilities submits a request for space utilization analytics. IT submits a request for wireless capacity planning tools. Energy management wants demand-side data for HVAC. Student affairs wants engagement metrics. Custodial wants demand-based routing. They’re all asking for the same thing — understanding who’s where, when, and in what numbers — but they’re telling separate stories to separate budget owners.
Whichever department holds the budget can only measure its own return. A facilities-led initiative gets evaluated on space planning outcomes alone, even though energy, custodial, and student affairs benefit equally from the same data.
Five departments submitting five asks for capabilities that share a single data source. Nobody connects them because nobody owns the cross-domain view.
The value isn’t additive — it’s compounding. Better occupancy data improves custodial routing, which reduces labor costs, which frees budget for AP upgrades, which improves data accuracy, which sharpens space planning. The flywheel only turns if someone sees it whole.
The core insight for leadership: this is a coordination problem, not a value problem. No single department can justify the investment alone — but all of them together justify it several times over.
Occupancy analytics isn’t theoretical. Named institutions are measuring real outcomes.
| Domain | Observed Impact | Evidence | Maturity |
|---|---|---|---|
| Space Planning | Avoided or deferred capital construction ($5M–$100M+) |
| Proven |
| Energy | $100K+ summer pilot, ~$500K projected annual | UT San Antonio: Watt Watchers pilot, occupancy-informed HVAC | Proven |
| Custodial | 30% efficiency gain in high-traffic spaces | University of Kentucky: demand-aligned restroom scheduling at Gatton (97→99% service satisfaction) | Proven |
| Student Engagement | Measured engagement/attendance lift; informed space investment | Colorado Mesa University: 50% increase in First-Year Initiative students attending class more frequently vs. control group (94% attendance-detection accuracy) | Proven (Colorado Mesa) |
| Dining / Food Services | Hidden demand–supply mismatches; reduced labor waste | Northeast R1 University: its #1 lunchtime destination had zero dining, with over 80% of people dwelling rather than passing through; 6 of the top 10 lunchtime destinations had no general-access dining | Validated |
| Network / IT | Reduced AP refresh waste; targeted investment | Data-informed redesigns vs. blanket replacements | Emerging |
Three domains have proven, measured outcomes at named institutions. Two are validated through deployment experience. One is emerging. The compound case doesn’t need all six delivering — it needs enough to exceed the platform cost by a multiple.
When you present to leadership, answer one question: what does this institution gain by treating occupancy analytics as an enterprise investment instead of a departmental tool? Structure the conversation in five parts.
The presentation works best when your domain champions are present — not to pitch, but to validate. When the CFO asks “is the energy number real?” the energy manager answers from their own experience. When the provost asks “how does this affect capital planning?” the space planner answers.
You don’t need all six. Three champions across three domains — each speaking from their own operational perspective — is enough to make the case credible.
Be explicit about what this isn’t.
Not a facilities project. It’s institutional infrastructure that serves facilities, IT, student affairs, energy, custodial, and dining at the same time.
Not new hardware. It runs on the Wi-Fi infrastructure you’ve already invested in.
Not a multi-year buildout before value. Phase 1 — three to five buildings, 90 days — produces actionable data. The enterprise rollout follows the evidence.
Not a surveillance tool. It measures aggregate occupancy patterns at the building and zone level. No individual monitoring.
If leadership approves, the next step is straightforward: expand from pilot buildings to campus-wide coverage and activate the domains your champions identified.
If leadership wants more evidence, that’s fine too. Pilot data is your proof of concept. Offer to expand to two or three more buildings and bring back results in 90 days. Every expansion strengthens the compound case.
As CampusIQ’s Senior Director of Insights & Strategy, Alyson helps colleges and universities unlock the full potential of their campuses through data-informed decision making. With 20 years in higher education — including time spent working inside an institution — she brings a deep understanding of the challenges campus leaders face, and bridges analytics and strategy in a way that resonates with institutional needs. Her expertise spans space utilization analysis, operational assessments, and the frameworks that guide smarter planning. Her mantra: not all solutions are physical — true optimization considers how people and processes work together. A three-time alumna of the University of South Carolina, Alyson holds a BA in English, an MPA, and a Master’s in Higher Education Business Administration.
Connect on LinkedIn →
I’ve worked in higher education long enough to remember when space management was seen as a back-office task rather than a strategic one. Facilities...
When CampusIQ and Huron surveyed 31 universities across North America for the 2026 State of Space Management in Higher Education report, one finding...
by Veena Vadgama, CMO at CampusIQ